Cholesterol to HDL Ratio: What You Need to Know
Understanding your cholesterol numbers can feel overwhelming, but the cholesterol to HDL ratio simplifies cardiovascular risk assessment into a single, powerful metric. Moreover, recent research demonstrates that this ratio outperforms individual cholesterol measurements in predicting heart disease risk, making it an essential tool for both patients and healthcare providers.
While many people focus solely on lowering their “bad” LDL cholesterol, the relationship between all cholesterol components tells a more complete story about cardiovascular health. Consequently, learning to interpret your cholesterol normal values through the lens of ratios can reveal hidden risks that standard measurements might miss.
What Is the Cholesterol to HDL Ratio?
The cholesterol to HDL ratio represents the balance between all cholesterol in your blood and the “good” HDL cholesterol that helps remove excess cholesterol from your arteries. Essentially, this calculation provides a snapshot of whether your cholesterol transport system is working efficiently or struggling to maintain cardiovascular health.
What Is the Cholesterol to HDL Ratio?
Research shows cholesterol to HDL ratios above 5.0 increase heart disease risk by up to 300% compared to ratios below 3.5, and that’s because this metric captures the critical balance between harmful and protective cholesterol particles more accurately than LDL levels alone. Specifically, this ratio provides insights that individual measurements often miss, particularly in people with borderline cholesterol levels who might otherwise be overlooked for treatment.
The Simple Calculation
Calculating your cholesterol to HDL ratio requires only two numbers from your lipid panel, and here’s how it works. The formula is straightforward – you divide total cholesterol by HDL cholesterol to get your ratio. For example, if your total cholesterol is 200 mg/dL and your HDL is 50 mg/dL, your ratio would be 4.0 because 200 divided by 50 equals 4.0.
Furthermore, this calculation works regardless of whether you use mg/dL or mmol/L units, provided both measurements use the same unit. Additionally, most healthcare providers can calculate this instantly during your appointment, and that’s because the math is simple enough to do without special equipment. Moreover, many modern lab reports now include the ratio automatically, which means you might already have this information without realizing it.
Why Ratios Matter More Than Individual Numbers
Individual cholesterol measurements can be misleading without context, and here’s why this happens so frequently. For instance, someone with total cholesterol of 220 mg/dL might seem at higher risk than someone with 180 mg/dL. However, if the first person has HDL of 70 mg/dL (ratio of 3.1) and the second has HDL of 35 mg/dL (ratio of 5.1), then the first person actually has better cardiovascular protection despite higher total cholesterol.
Additionally, this scenario occurs more often than most people realize because HDL levels vary dramatically between individuals. Moreover, certain populations naturally maintain higher HDL levels, and that’s because genetic factors play a significant role in cholesterol metabolism. Furthermore, lifestyle factors like exercise and diet can create substantial differences in HDL levels between people with similar total cholesterol numbers.
Consequently, healthcare providers increasingly rely on ratios rather than individual numbers when assessing cardiovascular risk. Indeed, major medical organizations now emphasize ratio calculations in their guidelines, and that’s because research consistently shows superior predictive value compared to isolated measurements.
Understanding Cholesterol Normal Values and Risk Categories
Understanding the specific risk categories associated with different cholesterol to HDL ratios helps you interpret your results more effectively. Moreover, these categories guide treatment decisions and help healthcare providers communicate risk levels clearly. Additionally, knowing these ranges empowers you to track progress and set realistic goals for improvement.
| Cholesterol to HDL Ratio | Risk Category | Cardiovascular Risk Level | Action Recommended |
|---|---|---|---|
| Below 3.5 | Ideal | Low Risk | Maintain current lifestyle |
| 3.5 to 4.4 | Good | Average Risk | Continue healthy habits |
| 4.5 to 5.0 | Borderline | Moderate Risk | Lifestyle modifications needed |
| 5.1 to 6.0 | High | Elevated Risk | Aggressive intervention required |
| Above 6.0 | Very High | Maximum Risk | Immediate medical treatment |
These categories serve as general guidelines, however, individual risk factors can modify these interpretations significantly. For instance, someone with a ratio of 4.2 might be considered higher risk if they have diabetes or a family history of heart disease. Conversely, an otherwise healthy person with no risk factors might be acceptable at the same ratio level, and that’s because cardiovascular risk involves multiple factors beyond cholesterol alone.
Furthermore, age plays a crucial role in interpreting these ratios because cardiovascular risk naturally increases with age regardless of cholesterol levels. Additionally, recent research suggests that very low ratios (below 2.5) might sometimes indicate other health issues, particularly if they result from unusually high HDL levels above 100 mg/dL.
Individual Cholesterol Component Normal Values
Understanding each component helps interpret your ratio more effectively, and here’s why each measurement matters individually. Moreover, knowing these ranges helps you identify which specific area needs attention when your ratio falls outside optimal ranges.
Total cholesterol normal values provide the foundation for ratio calculations. Specifically, optimal levels fall below 200 mg/dL, while borderline high ranges from 200-239 mg/dL, and high levels reach 240 mg/dL and above. However, total cholesterol alone doesn’t tell the complete story, and that’s because it includes both harmful and protective cholesterol types.
HDL cholesterol targets differ between men and women due to hormonal influences on lipid metabolism. For men, levels should reach 40 mg/dL or higher, with 50+ mg/dL being preferred for optimal protection. Meanwhile, women should maintain 50 mg/dL or higher, with 60+ mg/dL being ideal for maximum cardiovascular benefit. Additionally, protective levels of 60 mg/dL or higher benefit all adults regardless of gender, and that’s because higher HDL levels provide progressively better cardiovascular protection.
LDL cholesterol goals vary based on individual risk profiles, which means your target depends on other health factors. For the general population, levels below 100 mg/dL are appropriate, however, high-risk individuals should aim below 70 mg/dL. Furthermore, very high-risk patients may need levels below 55 mg/dL, and that’s because more aggressive targets provide additional protection for those most vulnerable to cardiovascular events.
Gender Differences in Cholesterol Normal Values
Importantly, men and women have different HDL targets, which affects their optimal cholesterol to HDL ratios significantly. Furthermore, women typically maintain higher HDL levels due to estrogen’s protective effects, particularly during reproductive years. However, these differences extend beyond simple numerical targets, and that’s because hormonal fluctuations throughout a woman’s life create varying cardiovascular risk profiles.
Men generally have optimal ratios below 5.0, with HDL minimums of 40 mg/dL and average ratios typically ranging from 4.5-5.0. Meanwhile, women should aim for optimal ratios below 4.0, with HDL minimums of 50 mg/dL and average ratios usually falling between 3.5-4.0. Additionally, these differences reflect underlying biological variations in lipid metabolism between genders.
Moreover, age affects these targets differently for men and women. Specifically, women’s cardiovascular risk remains relatively low until menopause, when estrogen levels decline dramatically. Consequently, post-menopausal women often see their ratios worsen as HDL levels drop and total cholesterol increases. Furthermore, this transition period requires closer monitoring and potentially more aggressive intervention than previously needed.
Advanced Cholesterol Ratio Calculations
Beyond the basic total cholesterol to HDL ratio, several other ratios provide additional cardiovascular insights, and that’s because different calculations highlight various aspects of lipid metabolism. Subsequently, understanding these advanced calculations can help identify specific risk patterns and guide targeted treatment strategies. Moreover, healthcare providers increasingly use multiple ratios to develop comprehensive risk assessments rather than relying on single measurements.
LDL to HDL Ratio
The LDL to HDL ratio focuses specifically on the balance between “bad” and “good” cholesterol, and here’s why this calculation provides unique insights. This ratio is calculated by dividing LDL cholesterol by HDL cholesterol, which gives you a direct comparison of harmful versus protective cholesterol particles. Furthermore, this specific ratio helps identify people who might have acceptable total cholesterol levels but dangerous imbalances between LDL and HDL components.
The ideal range for LDL/HDL ratios falls below 2.0, and that’s because this indicates excellent cholesterol balance with strong HDL protection against LDL-induced arterial damage. Moreover, ratios in this range suggest that your body has sufficient HDL particles to effectively remove excess LDL cholesterol from arterial walls. Additionally, people with ratios below 2.0 typically show the lowest rates of cardiovascular events in long-term studies.
Acceptable ranges span from 2.0-2.5, which shows adequate HDL levels to manage LDL cholesterol, however, monitoring remains recommended because slight increases could shift the balance unfavorably. Furthermore, individuals in this range often benefit from targeted HDL-raising interventions like increased exercise or dietary modifications.
Borderline risk occurs between 2.6-3.5, suggesting insufficient HDL relative to LDL levels and requiring lifestyle interventions. Specifically, this range indicates that harmful cholesterol particles may be overwhelming the body’s natural clearance mechanisms. Moreover, people in this category often have metabolic syndrome or insulin resistance, and that’s because these conditions typically suppress HDL production while increasing LDL levels.
High risk ratios above 3.5 indicate dangerous imbalance with inadequate HDL protection, necessitating aggressive treatment. Additionally, ratios this elevated often require combination therapy targeting both LDL reduction and HDL enhancement. Furthermore, immediate medical intervention becomes critical because the risk of cardiovascular events increases exponentially at these levels.
Non-HDL Cholesterol
Non-HDL cholesterol represents all atherogenic (plaque-forming) lipoproteins, and here’s how this calculation provides valuable insights. The formula involves subtracting HDL cholesterol from total cholesterol, which gives you the combined amount of all potentially harmful cholesterol particles. Moreover, this measurement captures not just LDL cholesterol, but also VLDL and other atherogenic particles that contribute to cardiovascular risk.
Furthermore, non-HDL targets are typically 30 mg/dL higher than LDL targets, and that’s because this measurement includes additional lipoproteins beyond just LDL. For the general population, levels below 130 mg/dL are appropriate, however, high-risk individuals should aim below 100 mg/dL. Additionally, very high-risk patients may need levels below 85 mg/dL to achieve optimal cardiovascular protection.
Triglyceride to HDL Ratio
This ratio indicates insulin resistance and metabolic dysfunction, which makes it particularly valuable for identifying diabetes risk. The calculation involves dividing triglycerides by HDL cholesterol, and elevated ratios often signal underlying metabolic problems before they become clinically apparent. Moreover, this ratio serves as an early warning system for metabolic syndrome development.
Optimal ratios fall below 2.0, indicating healthy insulin sensitivity and glucose metabolism. Meanwhile, concerning levels above 3.0 suggest developing insulin resistance and increased inflammation throughout the body. Furthermore, high risk ratios above 5.0 strongly predict diabetes development within the next five years, and that’s because severely elevated ratios reflect advanced metabolic dysfunction.
Clinical Interpretation: What Your Ratio Reveals

Your cholesterol to HDL ratio provides insights beyond simple cardiovascular risk assessment, and that’s because this calculation reflects underlying metabolic processes, genetic factors, and lifestyle influences that affect your long-term health trajectory. Additionally, it reflects the dynamic interplay between cholesterol production, absorption, and clearance systems in your body. Furthermore, clinicians increasingly use ratio patterns to identify specific metabolic disorders that might not be apparent from individual cholesterol measurements alone.
Metabolic Syndrome Indicators
Elevated cholesterol to HDL ratios often signal metabolic syndrome, which represents a cluster of conditions that dramatically increase both cardiovascular and diabetes risk. Moreover, this syndrome affects approximately one-third of American adults, however, many remain undiagnosed because symptoms develop gradually over years. Additionally, metabolic syndrome creates a cascade of interconnected problems that worsen over time if left untreated.
Metabolic syndrome diagnosis requires meeting at least three of the following criteria, and here’s why each factor contributes to cardiovascular risk. First, cholesterol/HDL ratios above 5.0 indicate poor lipid balance and inadequate cholesterol clearance mechanisms. Second, triglycerides above 150 mg/dL suggest insulin resistance and increased inflammation throughout the body. Third, HDL below 40 mg/dL in men or 50 mg/dL in women indicates compromised cholesterol removal capacity.
Additionally, blood pressure above 130/85 mmHg reflects vascular dysfunction and increased arterial stiffness. Furthermore, waist circumference above 40 inches in men or 35 inches in women indicates visceral fat accumulation that promotes inflammation. Finally, fasting glucose above 100 mg/dL suggests developing insulin resistance that affects lipid metabolism.
Consequently, people with metabolic syndrome often show characteristic lipid patterns that worsen cholesterol ratios significantly. Specifically, they typically have high triglycerides, low HDL cholesterol, and small, dense LDL particles that penetrate arterial walls more easily. Moreover, this combination creates particularly dangerous ratio patterns that require comprehensive intervention rather than simple cholesterol-lowering approaches.
Genetic Factors Affecting Ratios
Some individuals maintain healthy ratios despite poor lifestyle habits, while others struggle despite optimal behaviors, and that’s because genetic variations in cholesterol metabolism, HDL production, and lipid transport significantly influence your natural ratio baseline. Furthermore, understanding these genetic influences helps explain why identical lifestyle interventions produce dramatically different results between family members or friends.
APOE variants represent one of the most significant genetic influences on cholesterol ratios because these variations affect both cholesterol absorption and metabolism throughout the body. Moreover, people with APOE4 variants typically show greater sensitivity to dietary cholesterol and saturated fats, which means they may need more restrictive dietary approaches to achieve optimal ratios. Additionally, APOE2 carriers often maintain better ratios naturally, however, they may be more susceptible to triglyceride elevations.
CETP gene mutations influence HDL levels and ratio calculations significantly, and here’s why this matters for treatment planning. Specifically, certain CETP variants can cause extremely high HDL levels (above 100 mg/dL), which might seem beneficial but can actually indicate reduced HDL functionality. Furthermore, some people with CETP mutations may not respond well to traditional HDL-raising interventions because their HDL metabolism follows different pathways.
LDLR variations impact LDL clearance rates, which affects both total cholesterol levels and cholesterol to HDL ratios. Moreover, people with familial hypercholesterolemia have defective LDL receptors, causing dramatic cholesterol elevations from birth. Additionally, even mild LDLR variants can cause moderate cholesterol elevations that persist despite aggressive lifestyle interventions.
ABCA1 polymorphisms affect HDL cholesterol efflux capacity, which means they influence how effectively HDL particles remove cholesterol from arterial walls. Consequently, some people may have adequate HDL levels but reduced HDL functionality, resulting in higher cardiovascular risk despite apparently good ratios.
Factors That Influence Your Cholesterol to HDL Ratio
Understanding what affects your ratio empowers you to make targeted improvements, and here’s why this knowledge proves essential for successful intervention. Remarkably, some factors have immediate effects while others require months of consistent effort to produce meaningful changes. Moreover, the interplay between different factors can either amplify or diminish the effects of individual interventions, and that’s because cholesterol metabolism involves complex feedback loops throughout the body.
Diet and Nutritional Factors
Dietary choices directly impact both total cholesterol and HDL levels, consequently affecting your ratio in predictable ways. Furthermore, understanding which foods improve or worsen ratios helps you make informed decisions about meal planning and eating habits. Additionally, the timing and combination of different foods can influence their effects on cholesterol metabolism significantly.
Foods that improve your ratio work through multiple mechanisms simultaneously. Omega-3 fatty fish such as salmon, mackerel, and sardines raise HDL while reducing inflammation throughout the cardiovascular system. Moreover, these fish provide EPA and DHA fatty acids that directly support HDL particle functionality and improve cholesterol transport efficiency. Additionally, regular consumption of fatty fish can reduce triglycerides by 20-30%, which indirectly improves cholesterol to HDL ratios.
Nuts and seeds provide healthy fats that boost HDL production while supplying plant sterols that block cholesterol absorption in the intestines. Furthermore, the combination of monounsaturated fats, fiber, and plant sterols in nuts creates synergistic effects that maximize ratio improvements. Additionally, studies show that consuming one ounce of mixed nuts daily can improve ratios by 0.3-0.5 points within 12 weeks.
Olive oil and avocados supply monounsaturated fats that optimize cholesterol balance by preferentially raising HDL levels without significantly increasing total cholesterol. Moreover, extra virgin olive oil contains polyphenols that protect HDL particles from oxidative damage, maintaining their effectiveness in cholesterol transport. Additionally, replacing saturated fats with monounsaturated fats from these sources can improve ratios more effectively than simply reducing total fat intake.
Conversely, foods that worsen your ratio create problematic effects through different pathways. Trans fats simultaneously raise LDL and lower HDL cholesterol, creating the worst possible combination for ratio calculations. Furthermore, even small amounts of trans fats (2-3 grams daily) can worsen ratios significantly because these artificial fats interfere with normal lipid metabolism. Additionally, trans fats promote inflammation that reduces HDL functionality even when levels remain stable.
Exercise and Physical Activity Impact
Physical activity represents one of the most powerful interventions for improving cholesterol to HDL ratios. Furthermore, different types of exercise provide distinct benefits for cholesterol metabolism.
“Regular aerobic exercise can increase HDL cholesterol by 5-15% within 12 weeks, while simultaneously reducing total cholesterol by 3-6%, creating a substantial improvement in cholesterol ratios.”
Optimal Exercise Protocol for Ratio Improvement:
– Aerobic Exercise: 150-300 minutes moderate intensity weekly
– High-Intensity Intervals: 75-150 minutes weekly
– Resistance Training: 2-3 sessions weekly, major muscle groups
– Daily Movement: 8,000-10,000 steps for baseline activity
Lifestyle Factors and Environmental Influences
Beyond diet and exercise, numerous lifestyle factors significantly impact your cholesterol to HDL ratio, and that’s because cholesterol metabolism responds to multiple environmental and behavioral influences simultaneously. Moreover, these factors often interact synergistically, which means addressing several areas simultaneously produces greater improvements than focusing on single interventions. Additionally, some lifestyle modifications provide immediate benefits while others require weeks or months to show measurable effects.
Beneficial lifestyle modifications work through different pathways to improve cholesterol ratios. Quality sleep of 7-9 hours nightly supports healthy cholesterol metabolism because sleep deprivation disrupts hormone balance and increases inflammation throughout the body. Furthermore, poor sleep specifically reduces HDL production while increasing triglyceride synthesis, directly worsening cholesterol ratios. Additionally, sleep apnea can create chronic oxygen deprivation that damages HDL functionality even when levels appear normal.
Stress management proves crucial because chronic stress elevates cortisol levels that worsen ratios through multiple mechanisms. Moreover, elevated cortisol promotes abdominal fat accumulation that increases inflammation and reduces HDL cholesterol synthesis. Furthermore, stress often triggers unhealthy behaviors like emotional eating or smoking that compound the direct metabolic effects. Additionally, chronic stress activates inflammatory pathways that make HDL particles less effective at removing cholesterol from arterial walls.
Social connections correlate with better HDL levels, and here’s why relationships affect cholesterol metabolism. Specifically, people with strong social support networks show lower inflammatory markers and better lipid profiles than socially isolated individuals. Moreover, social activities often involve physical movement and stress reduction that directly benefit cholesterol ratios. Furthermore, social support helps people maintain healthy behaviors long-term, which proves essential for sustaining ratio improvements.
Moderate sun exposure supports cholesterol balance through vitamin D synthesis, which influences lipid metabolism in subtle but important ways. Additionally, vitamin D deficiency correlates with increased cardiovascular risk independent of cholesterol levels, suggesting complex interactions between vitamin D and lipid metabolism. However, excessive sun exposure creates oxidative stress that can damage HDL particles, so moderation remains important.
Detrimental lifestyle factors create opposing effects that worsen cholesterol ratios significantly. Cigarette smoking dramatically lowers HDL cholesterol levels through multiple pathways, including direct toxicity to HDL particles and increased inflammation throughout the cardiovascular system. Moreover, smoking increases LDL oxidation, making these particles more likely to penetrate arterial walls and form plaques. Additionally, smoking cessation typically improves HDL levels by 10-15% within 12 weeks, demonstrating the rapid reversibility of these effects.
Excessive alcohol consumption beyond moderate levels raises triglycerides significantly while potentially lowering HDL cholesterol, and that’s because alcohol metabolism interferes with normal lipid processing in the liver. Moreover, alcohol provides empty calories that promote weight gain, particularly visceral fat accumulation that worsens insulin resistance. Additionally, heavy drinking creates inflammation that damages HDL functionality even when HDL levels remain stable.
Chronic stress elevates cortisol and inflammatory markers through sustained activation of the hypothalamic-pituitary-adrenal axis. Furthermore, elevated cortisol specifically promotes the synthesis of VLDL cholesterol while reducing HDL production, directly worsening cholesterol ratios. Additionally, stress-induced inflammation makes existing HDL particles less effective at removing cholesterol from arterial walls.
Sedentary behavior reduces HDL production and clearance efficiency because muscle inactivity decreases the expression of genes involved in HDL metabolism. Moreover, prolonged sitting reduces lipoprotein lipase activity, which impairs the body’s ability to clear triglycerides from the bloodstream. Furthermore, sedentary behavior promotes insulin resistance that creates a cascade of metabolic problems affecting lipid balance.
Medical Conditions Affecting Cholesterol Ratios
Several medical conditions can significantly alter your cholesterol to HDL ratio, often requiring specialized treatment approaches, and that’s because underlying diseases affect lipid metabolism through different pathways than lifestyle factors. Consequently, understanding these relationships helps distinguish between lifestyle-related and pathological cholesterol imbalances. Moreover, some medical conditions can mask the effects of lifestyle interventions, making it appear that healthy behaviors aren’t working when the underlying disease requires direct treatment.
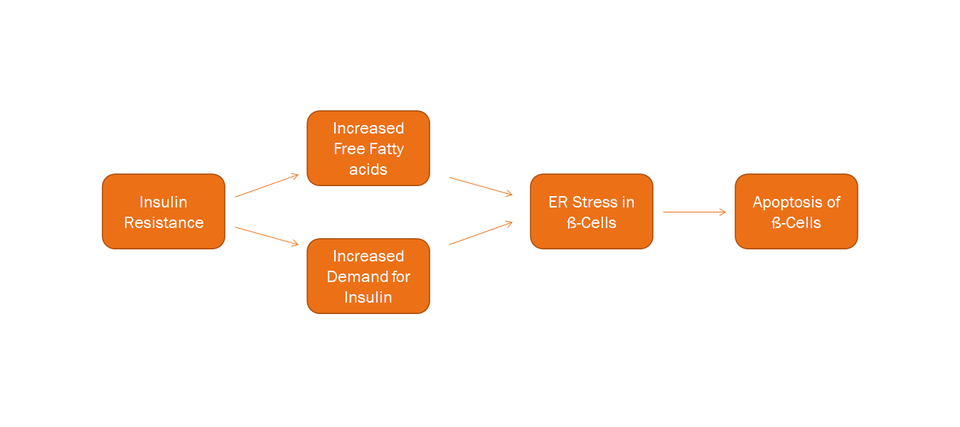
Diabetes and Insulin Resistance
Diabetes creates a characteristic lipid pattern called diabetic dyslipidemia, and here’s why this condition produces such distinctive cholesterol ratio problems. Individuals with diabetes typically exhibit elevated triglycerides, low HDL cholesterol, and small, dense LDL particles, resulting in poor cholesterol to HDL ratios despite sometimes normal total cholesterol levels. Moreover, insulin resistance affects lipid metabolism even before diabetes develops, which means ratio problems often precede clinical diabetes diagnosis by several years.
Furthermore, the metabolic dysfunction in diabetes affects multiple pathways simultaneously. Elevated glucose levels promote glycation of HDL particles, reducing their ability to remove cholesterol from arterial walls effectively. Additionally, insulin resistance increases hepatic production of VLDL particles while reducing HDL synthesis, directly worsening cholesterol ratios. Moreover, chronic inflammation associated with diabetes damages existing HDL particles and impairs their protective functions.
Management strategies for diabetic patients require more aggressive approaches than standard cholesterol treatment, and that’s because the underlying metabolic dysfunction creates ongoing challenges for lipid balance. Specifically, healthcare providers typically target cholesterol/HDL ratios below 4.0 for diabetic patients, which represents stricter goals than the general population. Additionally, focus shifts to triglyceride reduction through carbohydrate management because elevated triglycerides particularly worsen ratios in diabetic patients.
Moreover, HDL-raising interventions like exercise and niacin become priorities in diabetic management because these patients typically have the most room for HDL improvement. Furthermore, combination lipid therapy often becomes necessary earlier in the treatment course because diabetes creates multiple lipid abnormalities that require different therapeutic approaches simultaneously.
Thyroid Disorders
Both hyperthyroidism and hypothyroidism significantly impact cholesterol metabolism:
Hypothyroidism Effects:
– Increases total cholesterol by 20-50%
– Minimally affects HDL levels
– Substantially worsens cholesterol to HDL ratios
– Often normalizes with adequate thyroid hormone replacement
Hyperthyroidism Effects:
– Decreases total cholesterol significantly
– May reduce HDL cholesterol proportionally
– Can create falsely reassuring ratio improvements
– Requires careful monitoring during treatment
Liver Disease and Cholesterol Ratios
The liver produces most cholesterol and all HDL particles, making liver function crucial for accurate ratio interpretation:
Liver Disease Impacts:
– Fatty Liver Disease: Often associated with metabolic syndrome and poor ratios
– Hepatitis: May artificially lower total cholesterol production
– Cirrhosis: Dramatically reduces HDL synthesis and cholesterol clearance
– Alcohol-Related Liver Disease: Creates complex pattern of lipid abnormalities
Medications That Affect Cholesterol Ratios
Understanding how medications influence your cholesterol to HDL ratio helps optimize treatment strategies and avoid unintended consequences. Additionally, some medications can mask or exaggerate ratio changes, affecting clinical interpretation.
Statin Medications
Statins remain the gold standard for cholesterol management, but their effects on ratios vary:
Statin Effects on Ratios:
– Total Cholesterol Reduction: 20-55% depending on intensity
– HDL Cholesterol Increase: Modest 2-10% improvement
– Net Ratio Improvement: Significant due to greater total cholesterol reduction
– Individual Variation: Genetic factors influence statin response patterns
Other Lipid-Lowering Medications
Ezetimibe:
– Reduces cholesterol absorption by 50-60%
– Minimal impact on HDL levels
– Improves ratios primarily through total cholesterol reduction
PCSK9 Inhibitors:
– Dramatic LDL reduction (50-70%)
– Minimal HDL effects
– Substantial ratio improvements in high-risk patients
Niacin:
– Powerful HDL-raising effects (15-35% increase)
– Moderate total cholesterol reduction
– Excellent for ratio optimization, but side effects limit use
Medications That Worsen Ratios
Medications Requiring Monitoring:
– Beta-blockers: May reduce HDL by 5-15%
– Thiazide diuretics: Can increase total cholesterol and triglycerides
– Corticosteroids: Raise total cholesterol and lower HDL
– Hormonal contraceptives: Variable effects depending on formulation
Advanced Testing: Beyond Basic Cholesterol Ratios
While standard lipid panels provide valuable information, advanced testing can reveal additional insights about cardiovascular risk and cholesterol metabolism. Therefore, understanding when to pursue advanced testing helps optimize risk assessment and treatment strategies.
Particle Size and Number Testing
Advanced lipid testing analyzes cholesterol particle characteristics beyond simple concentration measurements:
LDL Particle Analysis:
– Large, Fluffy LDL: Less atherogenic despite higher concentrations
– Small, Dense LDL: More dangerous due to increased arterial penetration
– LDL Particle Number: Often more predictive than LDL concentration
HDL Functionality Testing:
– HDL2 vs HDL3 Subfractions: HDL2 provides superior cardiovascular protection
– Cholesterol Efflux Capacity: Measures HDL’s ability to remove cholesterol from arteries
– HDL Anti-inflammatory Function: Assesses protective mechanisms beyond cholesterol transport
Genetic Testing for Cholesterol Metabolism
Pharmacogenetic testing can guide personalized cholesterol management:
Useful Genetic Markers:
– APOE genotype: Influences diet and statin response
– SLCO1B1 variants: Predict statin-induced muscle problems
– CYP2C19 polymorphisms: Affect clopidogrel metabolism in combination therapy
– PCSK9 variants: Determine candidacy for PCSK9 inhibitor therapy
Inflammatory Markers and Risk Assessment
Cholesterol ratios combined with inflammatory markers provide comprehensive risk assessment:
Complementary Biomarkers:
– High-sensitivity C-Reactive Protein (hsCRP): Indicates arterial inflammation
– Lipoprotein(a) [Lp(a)]: Genetic risk factor unaffected by lifestyle
– Apolipoprotein B (ApoB): Measures atherogenic particle number
– Homocysteine: Indicates methylation and B-vitamin status
Strategies to Improve Your Cholesterol to HDL Ratio
Optimizing your cholesterol to HDL ratio requires a multifaceted approach targeting both total cholesterol reduction and HDL enhancement. Remarkably, some interventions work synergistically to maximize ratio improvements within months.
Evidence-Based Dietary Interventions
The most effective dietary approach combines cholesterol-lowering and HDL-raising foods while eliminating ratio-worsening ingredients:
The Portfolio Diet Approach:
This clinically-validated strategy combines four cholesterol-improving food categories:
✅ Daily Portfolio Diet Components:
- Plant Sterols: 2g daily from fortified foods or supplements
- Viscous Soluble Fiber: 10-25g from oats, barley, psyllium, beans
- Soy Protein: 25g daily from tofu, tempeh, soy milk, edamame
- Tree Nuts: 30g (1 oz) daily from almonds, walnuts, pistachios
Mediterranean Diet Modifications:
The traditional Mediterranean diet enhances cholesterol ratios through multiple mechanisms:
– Extra Virgin Olive Oil: 2-3 tablespoons daily provide oleic acid for HDL synthesis
– Fatty Fish: 3-4 servings weekly supply omega-3s for ratio optimization
– Red Wine: 1 glass daily (optional) may raise HDL modestly
– Antioxidant-Rich Foods: Berries, pomegranates, and dark chocolate reduce oxidation
Targeted Exercise Protocols
Different exercise modalities provide distinct benefits for cholesterol ratio improvement:
⏳ 12-Week Ratio Improvement Exercise Protocol
High-Impact Exercise Activities:
– Swimming: Full-body aerobic exercise that maximally improves HDL
– Cycling: Lower-impact option for consistent aerobic training
– Resistance Training: Essential for maintaining muscle mass and metabolic health
– Yoga: Stress reduction benefits complement cardiovascular exercise
Supplement Strategies
While lifestyle modifications remain primary, targeted supplementation can enhance ratio improvements:
Evidence-Based Supplements:
– Omega-3 Fatty Acids: 1-2g daily EPA/DHA raise HDL and reduce triglycerides
– Niacin (Nicotinic Acid): 500-2000mg daily under medical supervision for HDL
– Plant Sterols: 2g daily reduce cholesterol absorption by 6-15%
– Red Yeast Rice: Contains natural statins but requires quality control
– Berberine: 500mg twice daily improves ratios through multiple mechanisms
Monitoring and Tracking Your Progress
Successful cholesterol ratio improvement requires systematic monitoring and adjustment of interventions. Furthermore, understanding normal variation helps distinguish meaningful changes from laboratory fluctuations.
Optimal Testing Frequency
Initial Assessment Phase:
– Baseline lipid panel with full ratio calculations
– Recheck at 6-8 weeks after starting interventions
– Additional testing at 12 weeks if significant changes made
Maintenance Monitoring:
– Annual testing for low-risk individuals with optimal ratios
– Every 6 months for those with borderline ratios or ongoing interventions
– Every 3 months for high-risk individuals or medication adjustments
Understanding Test Variability
Cholesterol measurements can vary significantly between tests due to biological and technical factors:
Sources of Variation:
– Biological Variation: 5-10% variation normal between tests
– Seasonal Changes: Cholesterol often higher in winter months
– Recent Illness: Can temporarily alter lipid levels for weeks
– Laboratory Differences: Different labs may show 3-5% variation
– Fasting Status: Non-fasting samples may show higher triglycerides
Technology Tools for Tracking
Modern technology simplifies cholesterol monitoring and progress tracking:
Mobile Health Apps:
– Track lipid panel results over time with trend analysis
– Calculate ratios automatically and compare to targets
– Set medication and testing reminders
– Share data with healthcare providers
Home Testing Options:
– Fingerstick cholesterol meters for frequent monitoring
– Mail-in lipid panels for convenient testing
– Continuous glucose monitors for diabetic patients
Special Populations and Considerations
Cholesterol to HDL ratio interpretation varies across different populations and life stages. Consequently, understanding these variations ensures appropriate risk assessment and treatment decisions.
Children and Adolescents
Pediatric cholesterol management focuses on identifying genetic conditions and establishing healthy patterns. The CDC recommends cholesterol screening for children and adolescents:
Pediatric Testing Guidelines:
– Universal screening between ages 9-11 and 17-21
– Earlier testing for children with family history of premature heart disease
– Different normal values: total cholesterol <170 mg/dL, HDL >45 mg/dL
Family-Based Interventions:
Childhood cholesterol problems often reflect family-wide lifestyle patterns, requiring comprehensive approaches:
– Dietary Education: Focus on family meal planning and cooking skills
– Activity Programs: Encourage family-based physical activities and sports
– Screen Time Limits: Reduce sedentary behavior that worsens ratios
– Positive Reinforcement: Celebrate healthy choices rather than restricting foods
Elderly Populations
Cholesterol management in older adults requires balancing cardiovascular benefits with overall health status:
Age-Related Considerations:
– Statin Benefits: May diminish after age 85 without established heart disease
– Medication Interactions: Higher risk of drug interactions in polymedication patients
– Frailty Assessment: Aggressive cholesterol lowering may not benefit frail elderly
– Life Expectancy: Treatment benefits require years to materialize
Pregnancy and Women’s Health
Hormonal changes significantly affect cholesterol ratios throughout women’s lives:
Reproductive Years:
– Estrogen generally maintains favorable ratios
– Hormonal contraceptives may worsen ratios depending on formulation
– Pregnancy dramatically increases all cholesterol components
Menopause Transition:
– Total cholesterol typically increases 10-15%
– HDL cholesterol often decreases
– Ratio changes may indicate need for intervention
“The menopausal transition represents a critical window for cardiovascular risk assessment, as previously protective hormonal factors decline rapidly, often revealing underlying metabolic dysfunction.”
Emerging Research and Future Directions
The field of cholesterol ratio assessment continues evolving with new research revealing more sophisticated approaches to cardiovascular risk prediction. Additionally, personalized medicine approaches promise more precise interventions based on individual genetic and metabolic profiles.
Artificial Intelligence in Risk Assessment
Machine learning algorithms increasingly incorporate cholesterol ratios with other biomarkers to enhance risk prediction:
AI Applications:
– Pattern Recognition: Identify subtle ratio patterns predictive of events
– Personalized Targets: Calculate individual optimal ratios based on genetics
– Treatment Optimization: Predict response to specific interventions
– Risk Refinement: Combine multiple biomarkers for precise risk stratification
Novel Biomarkers and Ratio Refinements
Researchers continue identifying new markers that enhance traditional ratio calculations:
Emerging Biomarkers:
– PCSK9 Levels: Predict response to PCSK9 inhibitor therapy
– Ceramides: Lipid species that may predict cardiovascular events independent of cholesterol
– Microparticles: Cellular fragments that indicate vascular inflammation
– Metabolomics Profiles: Complete metabolic fingerprints for personalized assessment
Precision Medicine Applications
Future cholesterol management will likely incorporate genetic testing, advanced biomarkers, and personalized algorithms:
Personalized Approaches:
– Genetic Risk Scores: Combine multiple genetic variants for refined risk assessment
– Pharmacogenetic Guidance: Select optimal medications based on genetic variants
– Lifestyle Genomics: Personalize diet and exercise based on genetic responses
– Biomarker Panels: Use multiple markers for comprehensive risk assessment
Common Myths and Misconceptions
Despite extensive research, numerous misconceptions persist about cholesterol ratios and their interpretation. Therefore, addressing these myths helps ensure accurate understanding and appropriate action.
Practical Action Steps for Ratio Optimization
Transforming knowledge into action requires specific, achievable steps that progressively improve your cholesterol to HDL ratio. Subsequently, following a structured approach maximizes the likelihood of sustainable improvements.
30-Day Quick Start Protocol
✅ Week 1 Actions:
- Obtain current lipid panel and calculate your cholesterol to HDL ratio
- Eliminate trans fats and reduce saturated fat intake
- Add 20 minutes daily walking or equivalent exercise
- Include one handful of nuts daily
✅ Week 2 Actions:
- Increase exercise to 30 minutes daily aerobic activity
- Add soluble fiber sources to two meals daily
- Replace refined grains with whole grain alternatives
- Include fatty fish twice this week
✅ Week 3 Actions:
- Add resistance training twice this week
- Experiment with plant sterol-enriched foods
- Reduce added sugar intake by 50%
- Implement stress reduction techniques daily
✅ Week 4 Actions:
- Achieve 150+ minutes weekly aerobic exercise
- Plan sustainable long-term dietary changes
- Schedule follow-up lipid panel for 6-8 weeks
- Identify support systems for ongoing lifestyle changes
Long-Term Maintenance Strategies
Sustaining improved cholesterol ratios requires ongoing attention and periodic adjustments:
Quarterly Assessments:
– Review lifestyle adherence and identify areas for improvement
– Adjust exercise routines to prevent plateaus and maintain motivation
– Update dietary approaches based on new research and personal preferences
– Schedule regular healthcare provider consultations for monitoring
Annual Evaluations:
– Comprehensive lipid testing with advanced markers if indicated
– Assess need for medication adjustments or additions
– Update cardiovascular risk assessment based on age and other factors
– Set new goals and modify interventions as needed
Conclusion: Your Path to Optimal Cholesterol Health
Understanding and optimizing your cholesterol to HDL ratio represents one of the most powerful strategies for protecting cardiovascular health and extending healthy lifespan. Indeed, this simple calculation provides more predictive value than individual cholesterol measurements while offering clear targets for improvement.
The journey to optimal cholesterol ratios begins with understanding your current status through comprehensive lipid testing. Subsequently, implementing evidence-based lifestyle interventions while working closely with healthcare providers ensures the most effective and safe approach to ratio optimization.
Remember that cholesterol management represents a long-term investment in your health, with benefits that compound over years and decades. Furthermore, the strategies that improve cholesterol ratios simultaneously enhance overall metabolic health, energy levels, and quality of life.
Whether you’re just beginning to address cholesterol concerns or looking to optimize already good numbers, the principles outlined in this guide provide a roadmap for success. Additionally, staying informed about emerging research and personalized medicine approaches will help you adapt your strategy as new evidence emerges.
Your cholesterol to HDL ratio is not just a number—it’s a window into your cardiovascular future and a modifiable risk factor under your control. By taking action today and maintaining consistent efforts over time, you can achieve optimal ratios that support decades of healthy, active living.
For comprehensive information about overall cholesterol management and advanced treatment strategies, visit our complete high cholesterol management guide.
References
Cleveland Clinic. Cholesterol: Understanding Levels & Numbers. April 2025.
University of Rochester Medical Center. Lipid Panel With Total Cholesterol: HDL Ratio.
Healthline. Cholesterol Ratio: Men vs. Women, HDL vs. LDL, and More. November 2024.
NCBI Bookshelf. Guidelines for the Management of High Blood Cholesterol. March 2025.
HealthCentral. Cholesterol Ratio: HDL vs LDL, Ideal Range, Chart, & Meaning. April 2025.
Healthline. Cholesterol Levels: By age, LDL, HDL, and More. April 2025.
MedlinePlus. Cholesterol Levels: What You Need to Know.
Cleveland Clinic. What Is HDL Cholesterol? June 2025.
Harvard Health Publishing. A closer look at good cholesterol. March 2023.
Centers for Disease Control and Prevention. Testing for Cholesterol. May 2024.
Related Articles
- High Cholesterol: Complete Guide to Understanding and Managing High LDL Levels
- Omega-3 vs Omega-6: Finding the Right Balance to Reduce Inflammation
- Plant Sterols: Natural Effective Supplements for Cholesterol(Opens in a new browser tab)
- Lower Cholesterol Supplements that actually work(Opens in a new browser tab)
- How to Get Rid of Inflammation in the Body: 7 Science-Backed Methods
Author Bio
The Remedy Verified Team translates complex metabolic science into clear, practical strategies for everyday health. About the Author
Disclaimer
This article is for educational purposes only and should not replace professional medical advice. Always consult with a qualified healthcare provider before making changes to your cholesterol management plan or starting new treatments. Individual responses to interventions may vary, and what works for one person may not be appropriate for another.